What-If Analysis
What-if analysis allows people to analyze different scenarios by changing input variables and observing the model outputs. It can help in recognizing the impact of individual variables on the KPI variable estimation (in case of AD with kpi-driven approach) and the impact on the anomaly indicator (for both approaches), making the process more efficient or reveal critical situations.
How it works
What-if analysis can be executed over anomaly detection jobs that produce detection outputs, so not over build-model, rebuild-model, what-if or rca jobs. The parent job is the job over which a what-if analysis is executed.
As input, variable name(s) and new values for specified timestamps must be provided. The new input values are merged with the original data inside the engine, and a detect call is executed over the new values using a model related to the parent job.
Possible timestamps for what-if analysis are given from the parent job (defined by rows), detecting only the timestamps close to the modified timestamps that are possibly affected (determined from the model).
This job's output is its result table, in the same form as that of its parent job. Accuracies are currently not returned.
Example
Wind turbine
This example demonstrates a what-if analysis on wind turbine data. Gearbox temperature is the KPI variable, and wind speed and rotor speed hour are additional predictors. The sampling period is 10 minutes. The model will be trained on the first 26 days of January and backtested on the next 12 days.
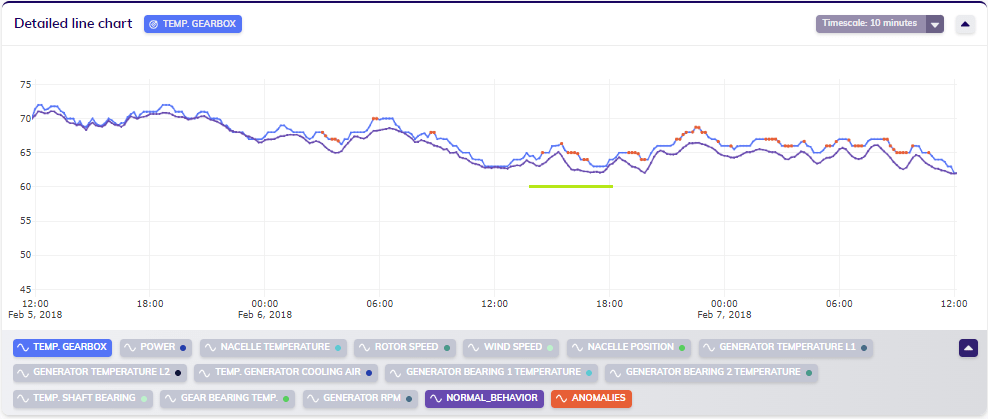
First, a build-model job with default settings is executed, after which a detect job is created and the anomaly detection results for both jobs are obtained. This example focuses on residual anomalies on 2018-02-06 between 13:30 and 16:00 (green line).

Then, what-if analysis is performed over the detect job with modified rotor speed, increasing the speed by 0.5 to 1 rpm (revolutions per minute). The configuration used in this example is provided below:
[
  {
    "column": "Rotor speed",
    "data": {
      "2018-02-06 13:30:00": 12.80,
      "2018-02-06 13:40:00": 12.79,
      "2018-02-06 13:50:00": 13.60,
      "2018-02-06 14:00:00": 13.66,
      "2018-02-06 14:10:00": 13.79,
      "2018-02-06 14:20:00": 13.77,
      "2018-02-06 14:30:00": 12,
      "2018-02-06 14:40:00": 12,
      "2018-02-06 14:50:00": 12,
      "2018-02-06 15:00:00": 12,
      "2018-02-06 15:10:00": 11.65,
      "2018-02-06 15:20:00": 11.74,
      "2018-02-06 15:30:00": 11.50,
      "2018-02-06 15:40:00": 11.50,
      "2018-02-06 15:50:00": 11.50,
      "2018-02-06 16:00:00": 11.52
    }
  }
]
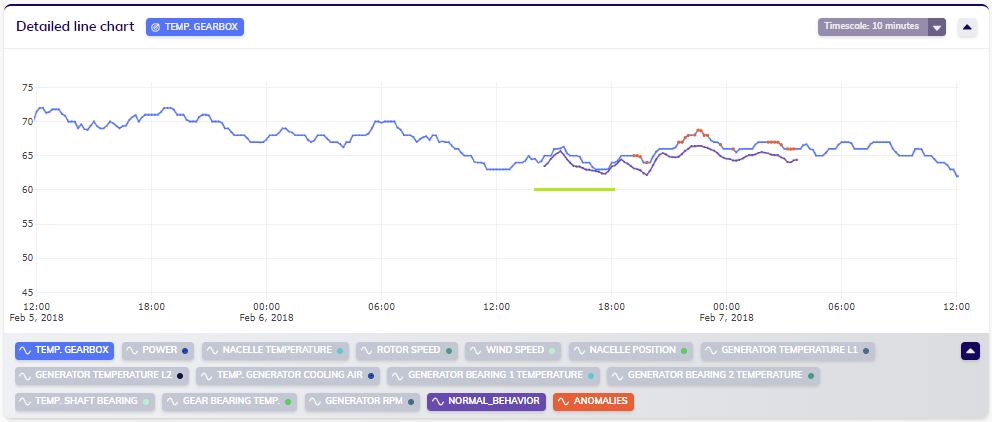
In the figure below, the results of the what-if analysis are visualized; the estimated normal behavior (purple line), the actual KPI variable (blue line) and the anomalies (orange dots) are shown. The what-if analysis detection period is shorter than the detection period of the original detect job. As mentioned before, only potentially affected timestamps are predicted for. Observe that the detected anomalies in the modified period (green line) on 2018-02-06 between 13:30 and 16:00 are no longer there. This means that the measured gearbox temperature would be normal for a higher rotor speed, but is anomalous for lower values of rotor speed. It is possible to manually test for which values an anomaly would still be detected and for which values not.
